

MARKET PULSE · NOVEMBER 2026 · 3-MINUTE READ
Each month we pull the latest numbers from the Canopy MLS, the database Charlotte-area agents use, so you can see what’s really happening with prices, choices and timing. Here’s the November read.
The headline: steady prices, more choice
- Prices are flat. The regional median sale price was $390,000 in September, down 1.3% from a year earlier. In August it was $410,000, up 2.5%. Month to month it bounces, but the trend is sideways.
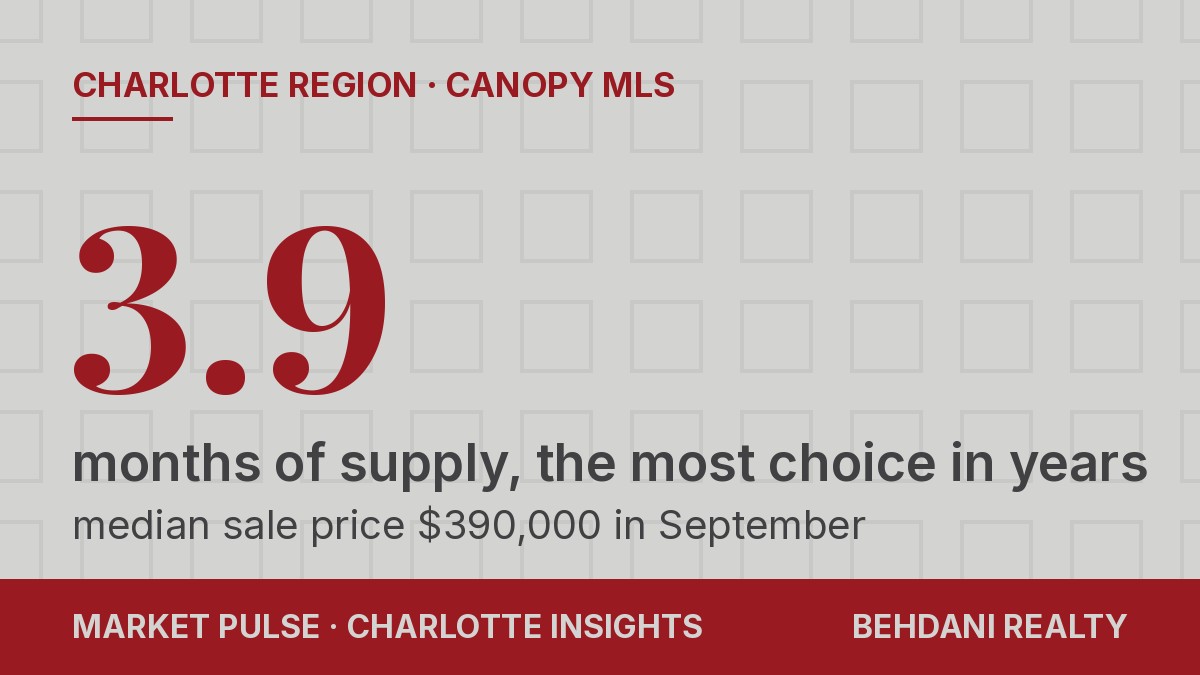
- Buyers have more to choose from. Inventory reached 14,284 homes in the week ending Oct 24, up 9.3% from a year ago, and months of supply hit 3.9 in September, up from 3.5.
- Homes take longer. It took 102 days from list to close in September, and sellers received 95.1% of their original list price on average, flat from last year.
City vs. county vs. region (August)
| August 2026 | City of Charlotte | Mecklenburg County | Charlotte Region |
|---|---|---|---|
| Median sale price | $427,500 (+0.6%) | $468,000 (+1.8%) | $410,000 (+2.5%) |
| Closed sales | 971 (−5.3%) | 1,230 (−6.4%) | 3,560 (−8.7%) |
| Homes for sale | 3,737 (+15.7%) | 4,543 (+12.7%) | 13,574 (+7.1%) |
| Months of supply | 3.7 (was 3.1) | 3.6 (was 3.1) | 3.7 (was 3.5) |
| Days on market | 47 (was 44) | 45 (was 44) | 55 (was 47) |
| % of list price received | 95.9% | 96.1% | 95.5% |
Inside the city, inventory is growing faster than across the region (up 15.7%), which is why city buyers are seeing more listings and more room to negotiate. Mecklenburg County still has the highest median price of the three at $468,000.
What it means for you
- Buying? This is the most balanced market in years. Look at homes that have been listed 30+ days; that’s where sellers are most open to offers and help with closing costs.
- Selling? Price to the market from day one. With 3 to 4 months of supply, buyers compare, and the first two weeks bring your best showings.
- Investing? Flat prices and longer market times give you room to negotiate. Run the numbers on rent, not on hoped-for appreciation.
Flat prices with more inventory isn’t a crash; it’s a market catching its breath after a few wild years. The homes that are priced right and show well still sell, often with more than one offer. If you’ve been waiting for a calmer market to buy, this is it.
Source: Canopy MLS, Charlotte Region, City of Charlotte and Mecklenburg County, August 2026, plus Charlotte Region September 2026 and the week ending Oct 24, 2026 (Canopy Realtor® Association, published Sept 29 and Nov 2, 2026). Data deemed reliable but not guaranteed. Properties may be listed or sold by various participants of the MLS.
Disclosures: Behdani Realty Company LLC is a licensed real estate brokerage in North Carolina and South Carolina. This article is general information only. It is not legal, tax, financial or investment advice, and it is not an offer to buy or sell any property. Facts come from the sources listed and can change. Equal Housing Opportunity.